Basic linux diag tech
Last Modified: June 3, 2013
Command: top
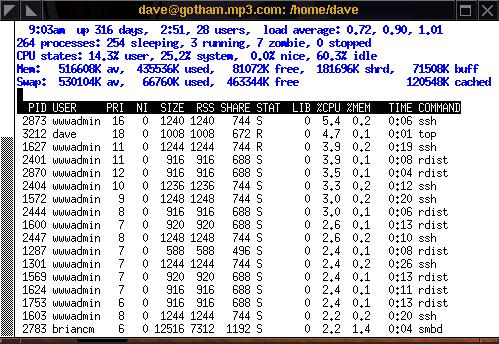
"load average" is CURRENT, 5 minutes ago, 15 minutes ago.
load is # of process waiting to execute
Really high system time usage is USUALLY caused by excessive disk io
Interactive Options:
Defaults to sort by cpu usage
M - Sort by Memory Usage
S - cumulative mode, shows cpu usage of process and its children
Command: iostat 1
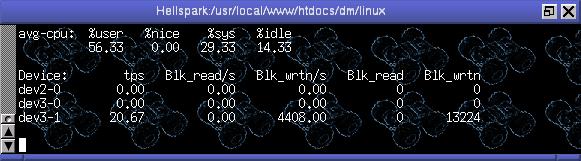
As you can see above dev3-1 (my IDE hard drive, SCSI is dev8) is very busy, with 20.67 Transacations Per Minute
its written a total of 13224 blocks at a rate of 4408 blocks a second
I recommend shrinking your xterm window so the updates don't scroll
This makes it alot easier to see what is going on. You can see above
How i've shrunk the term session down to fit the output of iostast
You might think to try "watch" but that will not work
Command: vmstat 1
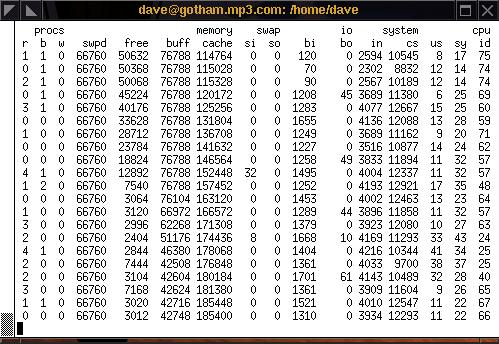
ALWAYS ignore first line of data on vmstat
bo/so "blocks/swap written OUT to disk"
bi/si "blocks/swap read IN from disk"
cs: The number of context switches per second. ~10k interactive terminal response suffers
Command: lsof /usr1
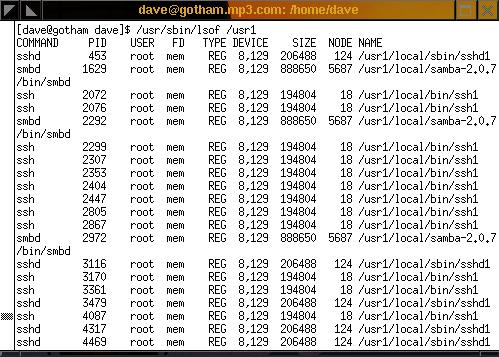
Very handy when you want to unmount a filesystem but someone is using it (like you being logged in as guest then sudoing, your still in /home/guest!)
Command: du -x --max-depth=1 |sort -n
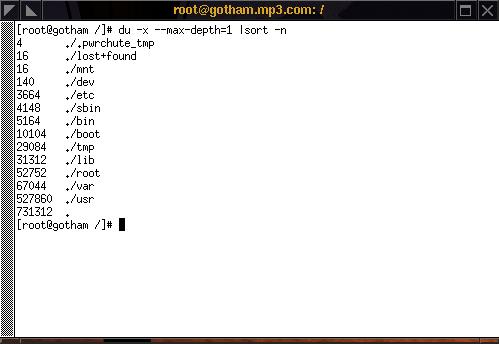
Shows you a sorted list of usage on 1 filesystem
Generic Bad Hardware diag:
dmesg and /var/log/messages are your friends, if the machine is still alive...
Here is a common disk error, usually means disk is toast
sdscext01 kernel: scsi0: MEDIUM ERROR on channel 0, id 2, lun 0, CDB: Read...
This is an nmi, it will show up when the cpu's pre-processor recieves a software interrupt that isn't in its table, usually indicated that there is a ram problem since compilers check for this. Could just be heavy io load or a crash
Mar 13 16:30:29 sdext27 kernel: Uhhuh. NMI received. Dazed and confused, but trying to continue
some random fun stuff:
Howto find the name of a process thats listening on a port: fuser -v 22/tcp
Howto find a process with ps and still have the info header: ps -ef |grep -e "httpd|PID"
Howto monitor # of process and their effect on the machine: watch -n 1 "echo processes && ps auxw |grep httpd |wc && vmstat 1 2"
Other Articles
Check this article for a list of awesome modern utils, I highly suggest checking out htop(top), dstat(vmstat/iostat), multitail(tail), mtr(traceroute) tmux(screen)
Check out this article for more old school linux goodies